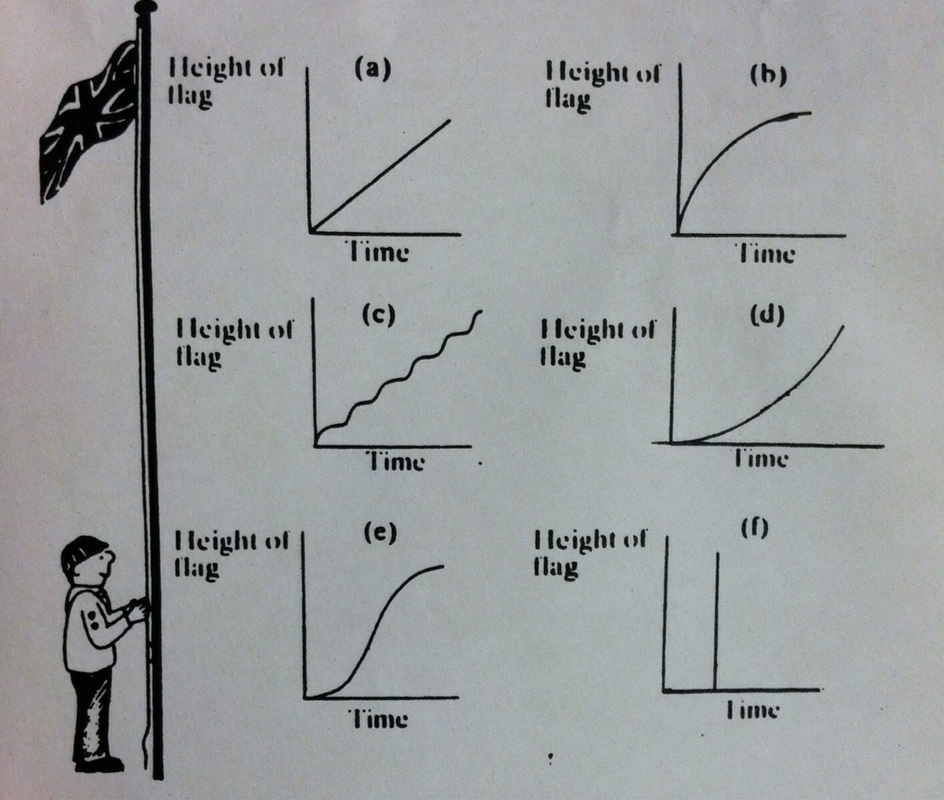
Graph A is an example of a constant rate incline.This graph doesn't show the situation realistically because the graph shows that the flag keeps going up, it doesn't show any kind of plateau.
Graph B is an example of when the flag raises faster than the time is going by.
Graph C shows the boy raises the flag fast then slows down, but then starts again and then took another break.
Graph D shows that he gradually took the flag up, because the rate of increase was gradual. This is the most realistic.
Graph E shows the boy hoisting the flag at a very fast rate, then slowing down, then picking up again.
Graph F shows that he raised the flag all at once without time passing, this is the most unrealistic of all the graphs.
 RSS Feed
