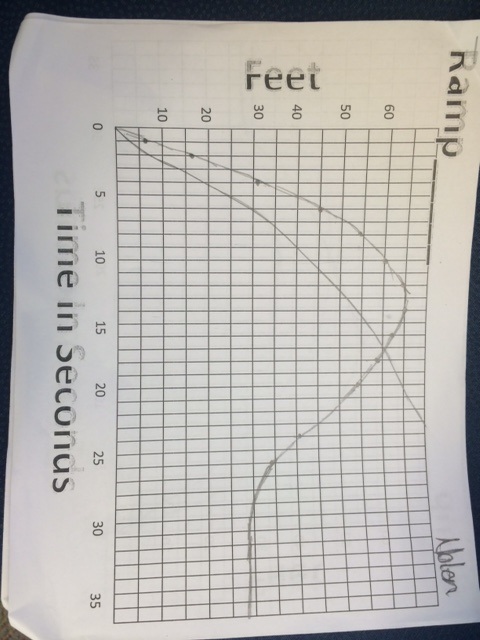
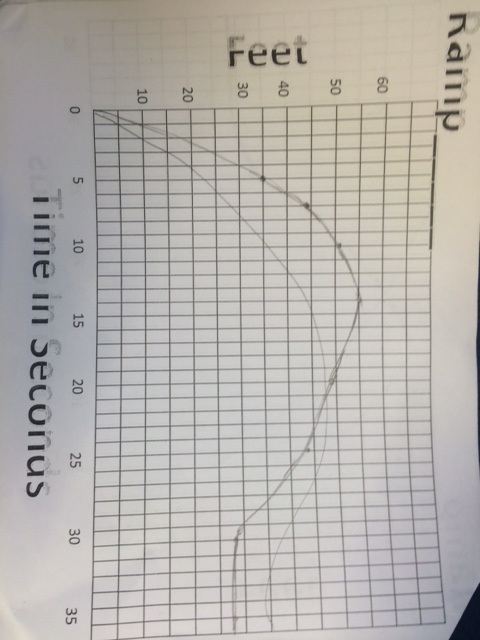
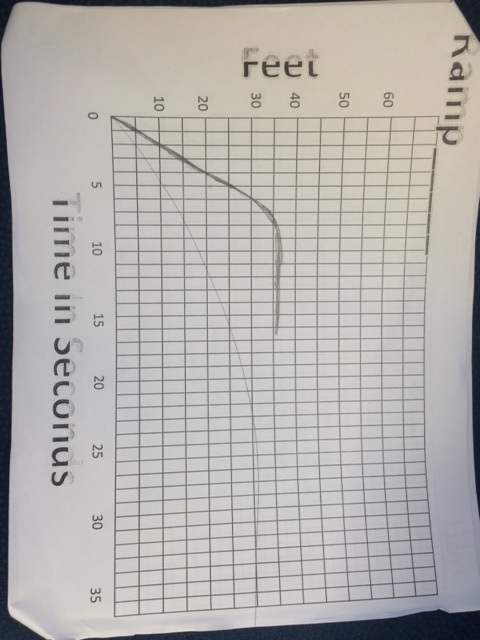
My predictions were not very close to the actual graph. They were different because i didn't put much effort into making the prediction as accurate as possible. My prediction was shaped that way because I thought that the longer it went the farther it would go. The zeros of my graph represent the starting point. All of the graphs have the same zero and minimum. The first graph had the highest maximum, the next graph had the second highest, and the third graph had the lowest maximum. When the graphs are increasing at a fast rate the slope is higher, and when the slope is decreasing quickly the slope is lower.
 RSS Feed
